Dashboards & Reporting
You need easy and timely access to your analytics information as a business owner.

Home / Digital Marketing Analytics / Marketing Dashboards & Reporting
Digital Marketing Reporting and Dashboards.
Your reporting framework has allowed you to determine the information you need as a business owner. Now let’s generate the reporting requirements so you have access to the RIGHT information.
Have a look at the following components and establish what systems you need for each report. Will you use excel? Which CRM system will you use? It’s also important to establish the timing of each report and the personnel who will be responsible for compiling these reports.
Daily Reporting
Primarily about activity and high-level results
These reports should answer questions like:
- How many phone calls did the sales reps make?
- How many leads did we get?
- How many people walked through our doors?
- How many sales did we make?
Weekly Reporting
Are we on track?
These reports should answer broader questions like:
- What did we achieve last week?
- What do we need to do this week?
- Are our results on track?
- What’s working well?
- What’s not working well?
Monthly Reporting
The devil is in the detail
These reports are much more comprehensive and granular. They cover:
- Revenue and sales
- Marketing statistics
- Conversion rates
- Results by product, location, department, person, unit, etc.
Dashboards
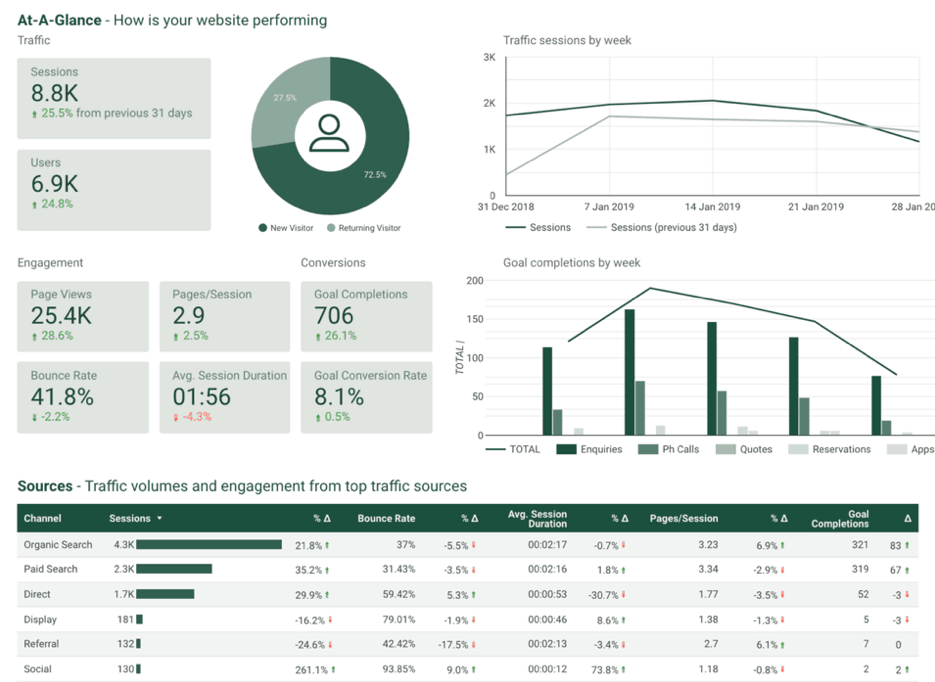
Bring everything together with real-time insights
The final piece to the puzzle is setting up dashboards so you can see quickly and easily the KPIs across your business and quickly identify:
- Are we on track?
- Where things are going astray?
- Indications and forecasts.
The beauty of technology is that these are all now fully automated and easy to set up. This means that with a click of a button, each sales rep and sales manager can see exactly where each person is within the pipeline and where things are being missed.
Weekly
- How did we go last week?
- What’s this week looking like?
- The big fish to get across the line
Monthly
- Past month
- This month
- Where are things breaking down?
You and your team need to create a regular rhythm to see where your key business metrics are at, where things are falling down and what you can do every day to get better and better, week after week and month after month.
Example Report Output

Looking for better analytics?
"*" indicates required fields


