How Merlo Coffee Uncovered Hidden Growth with Product Segmentation in Google Ads

From a blended ROAS to true SKU-level profitability—see how one of Australia’s favourite coffee roasters found 6-figure scale opportunities inside their existing campaigns.

Meet Merlo Coffee

Merlo Coffee is a well-established Australian coffee brand known for roasting fresh coffee daily and delivering it to cafes, retailers, and households nationwide.

With a focus on freshness, sustainability, and ethical sourcing, Merlo has built a strong online presence to complement its bricks-and-mortar Espresso Bars.

With over 30 coffee blends, brewing gear, accessories, and bundles in their Ecommerce store, the brand was running Google Shopping campaigns and Performance Max to drive sales. While the campaigns were delivering strong revenue, deeper insights into product-level performance were missing.

The Challenge in the Coffee Industry

Online coffee sales are booming, but the competition is intense:

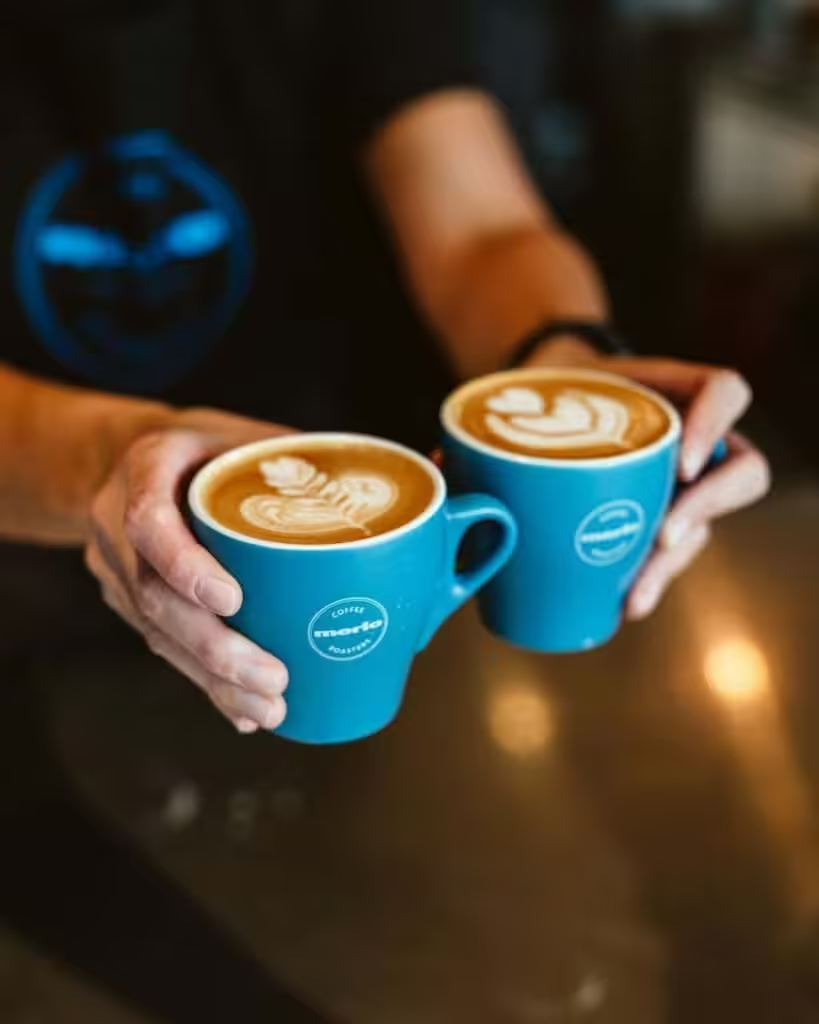
Customers expect fast delivery, premium packaging, and loyalty perks

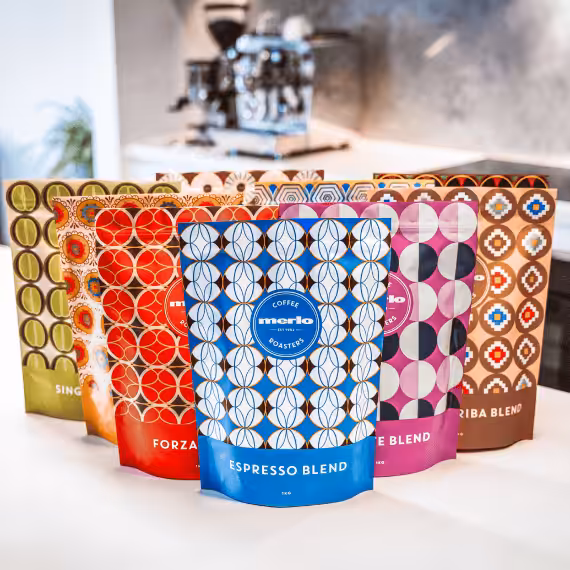
A wide range of SKUs—from beans to machines to bundles—make ad targeting complex

Buying habits vary: some search by flavour, others by grind, others by product type

Catch-all campaigns often favour generic best-sellers while ignoring niche or emerging blends

"Due North is a great agency to work with. Their communication is excellent, they've bought the digital strategy that is taking our marketing to the next level, and they are delivering on what they say they will. Very happy with our decision to bring them onboard."

- Pippa McCreery | Head of eCommerce, Merlo Coffee

What We Discovered in the Audit

Merlo’s Google Ads account had been running simplified category-based campaigns. While top-selling products were consistently scaling, there was:

Turning ROAS into Real Results with Product Segmentation

We implemented a product-level segmentation script to classify all products into five categories based on individual ROAS and profit contribution:

Over-Index

Strong ROAS, high profit (keep scaling)

Index

Decent ROAS, monitor closely

Near-Index

Break-even, potential for testing

No-Index

Not shown (visibility issue)

Under-Index

High spend, low/zero return

Next steps:

KPI Comparison Table

Metric Before After Change
Impressions 379,053 238,787 140,266
Clicks 3,320 2,349 971
Cost $2,468.32 $1,796.82 $671.50
Conv. Value $22,533.78 $26,613.75 $4,080.97
ROAS 9.13x 14.81x +5.68
Purchases 316.83 382.00 +65.17
Under-Index Spend $1,335.81 $102.63 Eliminated

We recovered around 50% in wasted spend a month, and reinvested it in products that now drive sustainable, scalable profit.

Key Takeaways for Ecommerce Advertisers

Don’t rely on blended ROAS - segment your product performance

Wasted spend hides in under-indexing products

High-potential products receiving almost no impressions or clicks

A strong blended ROAS masking what was actually driving profit

Unlock the Profit Hidden Inside Your Product Catalog

Get your free product segmentation audit and see how much performance you’re leaving on the table.

Get your free strategic plan of attack to 20% more qualified leads in 90 days

Thanks for the enquiry! We'll be in touch as soon as possible!

Get your free strategic plan of attack to 20% more qualified leads in 120 days

"*" indicates required fields

This field is for validation purposes and should be left unchanged.
This field is hidden when viewing the form

Scroll to Top