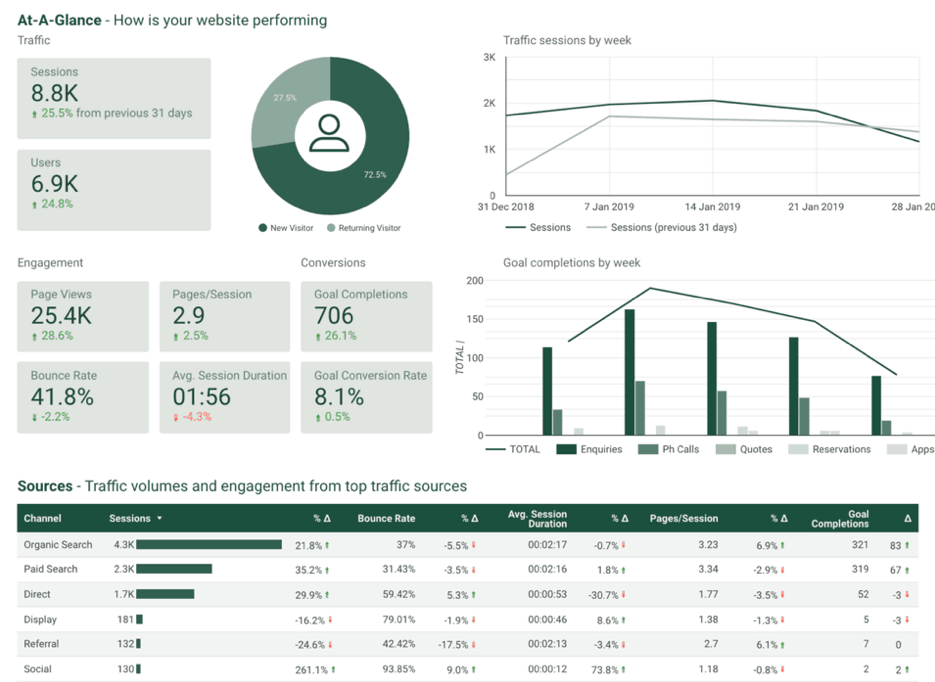
Marketing Optimisation
The Process of getting better and better and better and better and better.
Optimisation is a term applicable to everything you do in life. Whether it be work, family, health, or learning, it’s all about how you get that little bit better every day, week, month and year. Marketing is no different.
Einstein once said:
“compound interest as the eighth wonder of the world. He who understands it, earns it; he who doesn’t, pays it”
Optimisation is the process of implementing compound interest into your business.
That’s the real power of optimisation. Little increases along each part of marketing journey make big increases over the whole.
It needs to become an obsession, a passion of your business. How to implement a process of continuous improvement that generally looks like this:
- Reporting: Need the numbers to clearly tell us how well everything is (or isn’t) working
- Analysis: Deep diving into the numbers to interpret each component to determine exact outcomes
- Recommendations: How do we do more of the good, improve the mediocre and stop doing the bad
- Strategy and Plan: Once we know strategically what we are going to do, we need to add it into our management process
- Execute
- Repeat!
Reporting
After establishing your analytics framework, we will have access to accurate reports and dashboards that provide us with all the data that answers the mysterious questions of what’s working well and where things are falling down.
We generally recommend four stages of reporting:
- Daily – Two or three high level metrics that tell us how yesterday went and any major alarm bells. You might look at Total Visitors, Leads and Sales for example
- Weekly – Taking it to the next level, we want to look at approximately 5-7 core metrics that tell us how well last week went, and if there is anything urgent that we need to address, or change course
- Monthly – Once again drilling down to the detail, we want to look at all campaigns, all channels, all components of these campaigns and how well they have performed
- Quarterly – Detailed review of the whole quarter across all major touch points
The numbers provide the clarity that clearly tells us how well everything is (or isn’t) working.

Analysis
Once we have the reports, we need to deep dive into the data to explore a few core concepts:
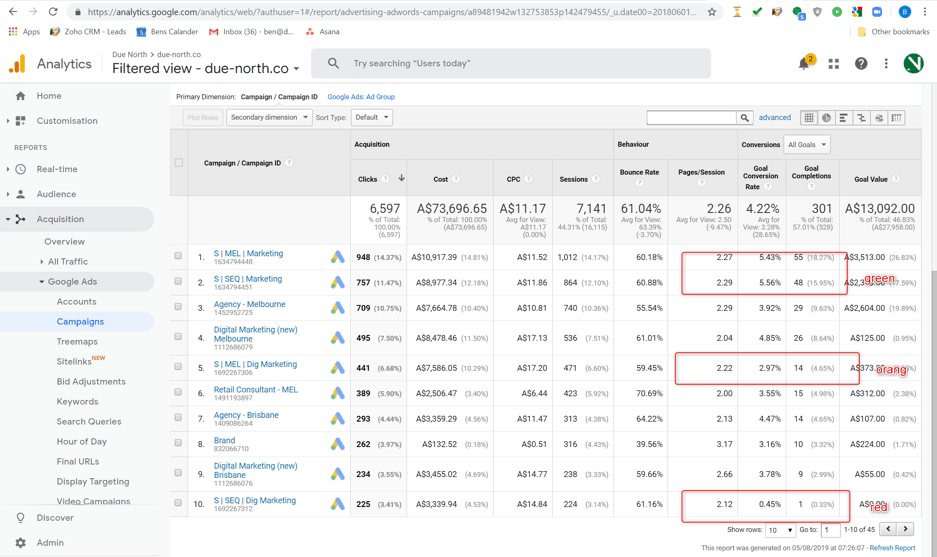
- Green lights: What’s working well and how can we do more of it
- Orange lights: What’s mediocre and how do we fix or improve
- Red Lights: What’s performing terribly, and do we need to get rid of it
Insight: Marketing is all about how we improve things. It’s not about how we create things. If you want Marketing to get you 5000% increases short term, your barking up the wrong tree – that’s a red light.
In this example:
- Green = converting well at over 5%
- Orange = Converting 2-4%
- Red = Converting below 2%

Recommendations
Once we know what’s working and not working, we can then provide recommendations on how we get better results:
- Shift budget to things that are converting well
- Stop doing campaigns that aren’t producing the required outcomes
- Improve messaging and content for mediocre campaigns
- Improve landing pages as they aren’t converting as well
Strategy, Plan and Execute
Once we know strategically what we are going to do, we need to add it into our management process
- What exactly needs to be done
- Who is going to do it
- When is it going to be done by
- How are we going to report on it to make sure it works
Repeat
- Then we repeat the whole process again!


